Pinewater Marine Weather
I designed and built Pinewater to make my beach trips more informed.
It turned into the only marine weather site in the U.S. that combines physical monitoring stations with satellite models, making forecasts more local and accurate than anywhere else.
Why did I build this?
Existing marine weather sites are so cluttered, ad-heavy, and never show all the data I need.
I just wanted to know if it's warm enough to swim, whether the waves will be rough, and where to set up my chair so it won't get swallowed by high tide, so I built Pinewater.
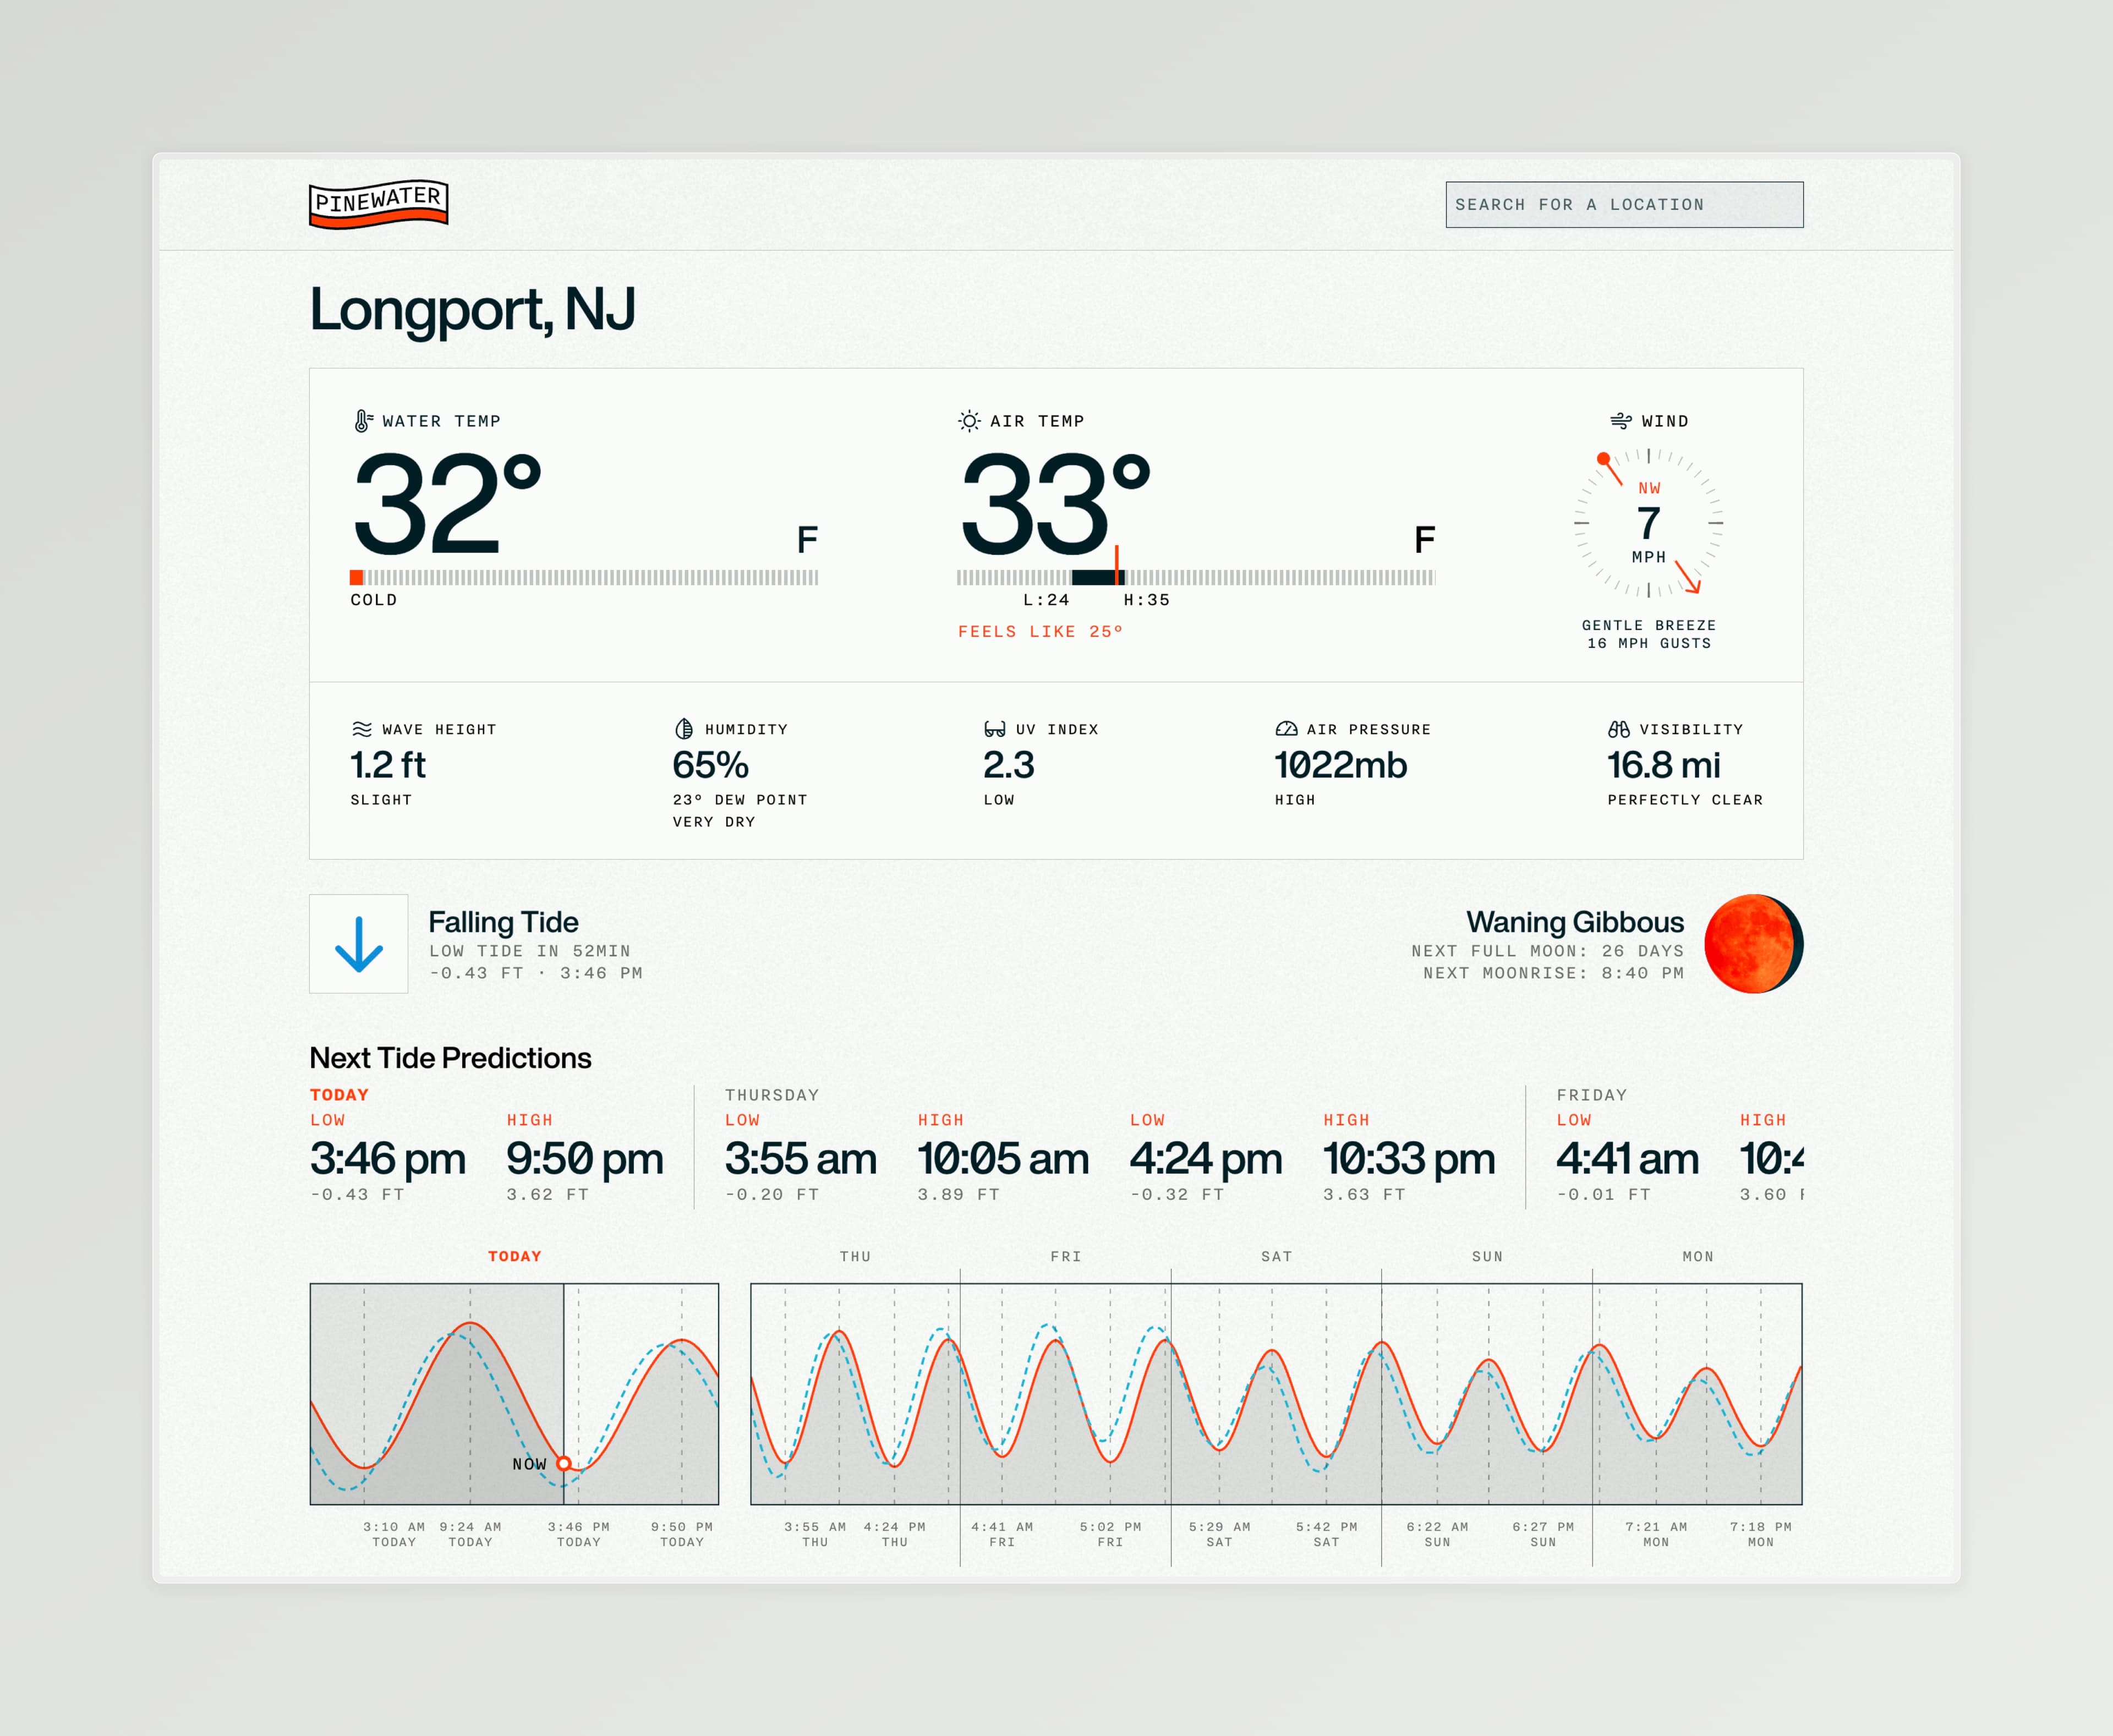
 Longport, NJ at low tide
Tide Graph
The only online tide chart that combines data from physical monitoring stations with satellite altimetry observations.
How it works
NOAA tide stations are physical gauges bolted to piers and jetties. They produce precise, harmonically-modeled predictions for high and low tides, but only exist at ~2,000 locations along the U.S. coast.
Satellite altimetry fills the gaps. Missions like Sentinel-6 measure ocean surface height from orbit, producing hourly sea level observations for any coordinate on Earth.
Why it matters
NOAA stations are often inside harbors or inlets, not on the open beach. Tides propagating through narrow channels arrive delayed and dampened, so the nearest station's prediction may not reflect what you actually see at the shore.
Satellite altimetry measures the open ocean directly, filling that gap — though it loses accuracy very close to the coastline, where radar returns mix land and water. Combining both sources on one graph gives you the full picture. No other marine weather site in the U.S. does this.
Widget Drill-Downs
Tapping any widget on the forecast page opens a detailed breakdown with interactive charts, daily comparisons, and contextual guidance.
Tap widget to open
Tap widget to open
Tap widget to open
Tap widget to open